
What We Learned About Input Tokens from 505 AI Development Sessions
Netsujo Inc. ·
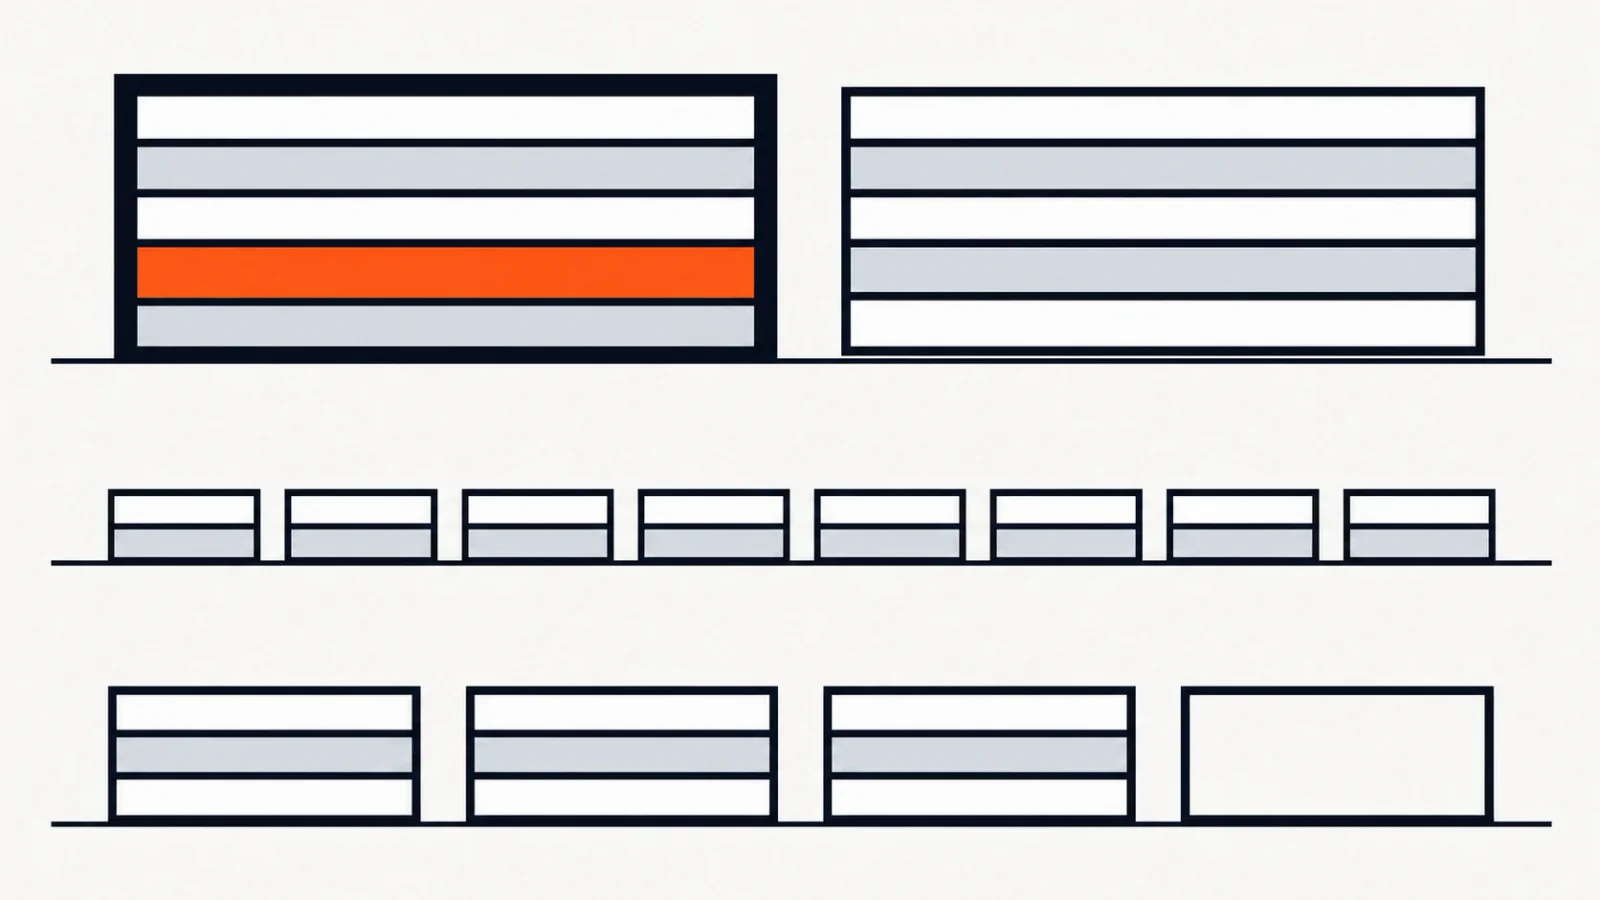
Counting requests in an AI development workflow does not tell us how much input the model reads. A short request can arrive with substantial background material. In a long conversation, later responses can receive much of the same context again. We needed measurements by launch route to decide where to investigate first.
At Netsujo, we read Claude Code transcripts stored on one Mac and measured 505 sessions. Median input on the first measurable response was 98,092 tokens for the desktop route and 16,676 for managed SDK execution. Those observations gave us a starting point for further investigation. This article explains what the figures measure and how to define a comparable measurement in your own operation.
1. Define the quantity before counting it
The selection window ran from November 12, 2026, at 01:00 to November 19 at 01:00 Japan Standard Time. In UTC, that is November 11 at 16:00 through November 18 at 16:00. We read 507 sessions: 505 had measurable input usage, while two remained unmeasured.
The seven-day window selects sessions by their first recorded timestamp. For each selected session, we aggregated the transcript available when it was read. Sessions that began earlier are excluded. The figures are not a per-response usage total clipped to those seven days.
Our unit of measurement was a model response in the main conversation, or main chain. This includes responses within tool-use loops. We did not read separate subagent transcripts, so the results do not represent all agent activity on that machine.
For each response, we added the recorded input_tokens, cache_creation_input_tokens and cache_read_input_tokens. Ordinary input, input used to create a cache and input read from a cache each count as one token in this measure. If another response reads the same text, we count that input again for that response. This measures the amount of context received across responses.
“First-response input” means the input on the first response for which usage was measurable in each session. It includes the initial request as well as loaded instructions and background context. This measurement does not isolate the contribution of instruction files.
2. Compare the first measurable response by launch route
We first took one input value per session to examine the starting context before a conversation grows. Routes were grouped by the entrypoint recorded in the transcript. The labels below describe routes observed in Netsujo's operation.
Table 1. Context on the first measurable response, in tokens
| Launch route recorded in the transcript | Measured sessions | Unmeasured sessions | First-response input p50 | First-response input p90 |
|---|---|---|---|---|
| Desktop route (claude-desktop) | 28 | 0 | 98,092 | 103,729 |
| Managed SDK route (sdk-cli) | 470 | 1 | 16,676 | 20,099 |
| CLI route (cli) | 7 | 1 | 66,033 | — |
| Total | 505 | 2 | — | — |
Source: Netsujo's internal measurement. Routes are grouped by the recorded entrypoint in our operation. First-response input includes both the loaded context and the initial request. p50 is the median; p90 is the 90th percentile. p90 is withheld for cli because fewer than ten sessions were measured.
We used the nearest-rank method for percentiles: sort the values and select the position obtained by rounding the required percentile rank upward. Keeping the calculation method and the rule for withholding small-sample statistics consistent helps make later measurements comparable.
The table makes the desktop route a reasonable candidate for closer inspection of starting context. Workloads differ between routes, however. We still need to establish how much of the difference comes from loaded background material and how much comes from the initial request. We did not run an experiment showing that moving the same work to the SDK would produce the SDK figure in this table.
A useful next comparison would hold the kind of task and the size of the initial request reasonably constant, then examine what information is loaded on every launch. First-response input is a way to locate settings and documents worth investigating.
3. Examine input across all measurable responses
The first response does not describe what happens as work continues. We therefore calculated the mean and median input over all measurable responses, including the first response.
Table 2. Input context per measurable response, in tokens
| Launch route | Measured responses | Mean input per response | Median input per response |
|---|---|---|---|
| claude-desktop | 14,659 | 279,188 | 234,384 |
| sdk-cli | 11,311 | 73,452 | 61,156 |
| cli | 2,929 | 220,011 | 189,861 |
Source: Netsujo's internal measurement. Responses include main-chain tool loops; they are not counts of human messages. The mean weights each response equally. Workload, model and session length were not controlled, and session counts differ between routes. Cached and uncached input tokens are counted equally here. These figures do not compare billing.
The managed SDK route had the most measured sessions, yet fewer responses than the desktop route and less input per response. Session counts alone would hide that difference.
The unit in Table 1 is a session. The unit in Table 2 is a response. A long session contributes more responses to Table 2, so it has more influence on those statistics. Looking at both tables lets us separate two questions: does a route begin with a large input, and does it receive large inputs across many responses?
The difference between the medians in the two tables is not a measurement of context growth within an individual conversation. To study that growth, we would need another aggregation that aligns responses by their position within each session.
4. Use the 74% share to choose an investigation order
In this measurement, the desktop route accounted for a rounded 74% of total input tokens across all measured responses. The 74% figure is a share of input tokens, not a share of cost. We gave cached and ordinary input equal weight. The share also tells us neither how much input was unnecessary nor how much could be removed.
What it supports is an order of investigation. Before changing every route, we can inspect the route contributing a large share of this measured total. We then need to evaluate whether that input was useful in the context of the task and its result.
For example, loading specifications that the task needs and repeatedly supplying unrelated documents call for different responses. This aggregation does not distinguish the two. It identifies a place where that distinction is worth examining.
An investigation of cost would need to retain the separate usage categories and reconcile them with the pricing applicable to those executions or actual billing records. An equally weighted token total cannot serve directly as a breakdown of charges.
5. Handle duplicate records and missing measurements separately
A response can appear in more than one log record. We used response identity information to avoid adding the same response twice, excluding 35,146 duplicate records. That is a correction to aggregation. It does not mean we prevented 35,146 unnecessary model executions.
Input received again by a different response still counts. A duplicate record of one response and repeated context across separate responses are different events for measurement purposes.
This read also excluded one malformed record and ten records with invalid usage data. The two sessions without measurable usage remained unknown. Assigning them zero tokens would mix an observation failure into the statistics as if it were a very small execution.
The published aggregates contain no conversation text. In your own measurement design, separating the aggregates you need from the storage of original transcripts can limit what must be shared to discuss operational trends. Transcript retention and access should continue to follow the organization's existing rules.
6. Separate two questions in your own measurement plan
Start by deciding what you want to know. “What characterizes sessions that started during this period?” and “How much usage occurred during this period?” require different selection rules. We measured the first. To measure the second, you would need to select individual responses by their timestamps and include conversations that started before the window.
Then investigate starting context and repeatedly received context in long conversations separately. For an initial-input comparison, align the kind of work and the initial request. For a comparison later in a conversation, align session length or response position. In both cases, check whether a reduction in input also changes information coverage or task outcomes.
A reusable measurement specification should record:
- The machine, runtime and launch routes, and which conversations are included.
- The session-selection rule, the read time and the transcript snapshot used.
- The usage categories included, the unit of deduplication and the treatment of missing measurements.
- Session-level and response-level metrics, including the percentile calculation.
- The conditions of the work being compared and the outcomes checked alongside input volume.
Active transcripts can grow. Reading them again later with the same seven-day selection window may produce different numbers. Reproducing an aggregate requires fixing the records available at the read time as well as the window definition.
Our result is a baseline for deciding what to investigate within a bounded scope: the Claude Code main chain on one Mac. Once the denominator and counting rules are explicit, we can examine why input is large and evaluate subsequent changes under comparable conditions.
If you want to connect AI development usage measurements with a practical improvement plan, discuss your AI development and operations workflow. Our AI implementation support page describes the scope of our work.